
Understanding Payment Processing: A Guide
Discover what payment processing is with Moneris. Learn how it empowers businesses and enhances customer transactions. Read more for insights.

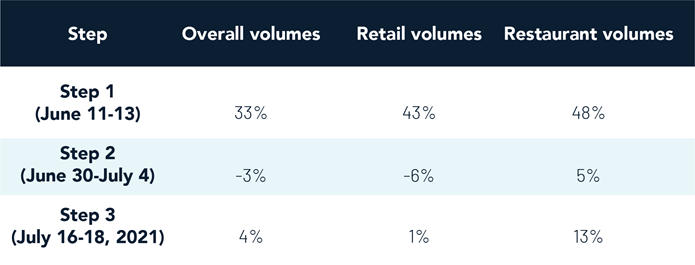
Step 3 of Ontario’s reopening began on July 16, 2021. There was a moderate increase at restaurants with the return of indoor dining but tourist attractions, recreational sports leagues, and gyms were where Ontarians spent the most money.
• Across the province volumes continue to climb although at a slower pace week-over-week (4%) compared to the first big opening at Step 1.
• Retail levels remained essentially the same week-over-week (1%) but spending at restaurants continued to climb with a 13% increase during the first weekend of indoor dining.
• The real winners of Step 3 were tourist attractions, recreational sports leagues, and gyms:
348% week-over-week increase at tourist attractions and exhibits (zoos, museums, tours, etc.)
187% week-over-week increase at commercial sports (recreational sports leagues, sports camps, etc.)
77% week-over-week increase at gyms and studios
Dufferin
• 9% increase in volumes overall
• 7% increase in volumes at retail
• 11% increase in volumes at restaurants
Durham
• 1% increase in volumes overall
• 12% increase in volumes at restaurants
• 17% increase in volumes at gyms and studios
• 27% increase in volumes at car rentals
Halton
• 2% increase in volumes overall
• 12% increase in volumes at restaurants
• 10% increase in volumes at gyms and studios
• 17% increase in volumes at car rentals
• 2482% increase in volumes at recreational sports leagues and camps
Hamilton
• 1% increase in volumes overall
• 9% increase in volumes at restaurants
• 25% increase in volumes at hotels
• 259% increase in volumes at car rentals
• 160% increase in volumes at recreational sports leagues and camps
• 211% increase in volumes at gyms and studios
Niagara
• 1% increase in volumes overall
• 6% increase in volumes at restaurants
• 24% increase in volumes at hotels
• 43% increase in volumes at car rentals
• 241% increase in volumes at gyms and studios
• 374% increase in volumes at tourist attractions and exhibits
Ottawa
• 6% increase in volumes overall
• 11% increase in volumes at restaurants
• 102% increase in volumes at recreational sports leagues and camps
Peel
• 0% increase in volumes overall
• 16% increase in volumes at restaurants
• 314% increase in volumes at gyms and studios
• 636% increase in volumes at recreational sports leagues and camps
Simcoe
• 4% increase in volumes overall
• 3% increase in volumes at retail
• 10% increase in volumes at restaurants
• 41% increase in volumes at car rentals
• 40% increase in volumes at gyms and studios
Toronto
• 8% increase in volumes overall
• 3% increase in volumes at retail
• 15% increase in volumes at restaurants
• 222% increase in volumes at gyms and studios
• 188% increase in volumes at tourist attractions and exhibits
• 234% increase in volumes at recreational sports leagues and camps
Waterloo
• 7% increase in volumes overall
• 4% increase in volumes at retail
• 13% increase in volumes at restaurants
• 78% increase in volumes at hotels
• 327% increase in volumes at gyms and studios
Wellington
• 0% increase in volumes overall
• 18% increase in volumes at restaurants
• 28% increase in volumes at hotels
York
• 4% increase in volumes overall
• 4% increase in volumes at retail
• 12% increase in volumes at restaurants
• 49% increase in volumes at gyms and studios
• 291% increase in volumes at recreational sports leagues and camps
Interested in getting rich and timely consumer spending data to make smarter strategic decisions? Easily support your new or ongoing policies, research, and forecasting models with Moneris Data Services.
Discover what payment processing is with Moneris. Learn how it empowers businesses and enhances customer transactions. Read more for insights.

This year’s data from Moneris shows how Canadians shopped smarter, seized the moment, and made their holiday dollars count during Black Friday and Cyber Monday

Moneris data reveals that the big concert in Toronto didn’t just captivate audiences—they were a game-changer for the city.
As part of our latest partnership with the Retail Council of Canada (RCC) we are pleased to present this excerpt of their latest retail sentiment report